
Visual Studio 2017 New Debugging Features
/Let's face it debugging your code isn't sexy. As coders, we probably spend the majority of our time debugging our code rather than actually coding. Coding means making money. Debugging usually means not making money. So there can be little fanfare for those that add features to debugging tools. However, I would say that these are the unsung heroes. With the release of Visual Studio 2017, there have been quite a few improvements and new features added to our debugging arsenal. I will only highlight a couple, but be sure to check out Kaycee Anderson's posts over on the Visual Studio blog for more information.
The New Exception Helper
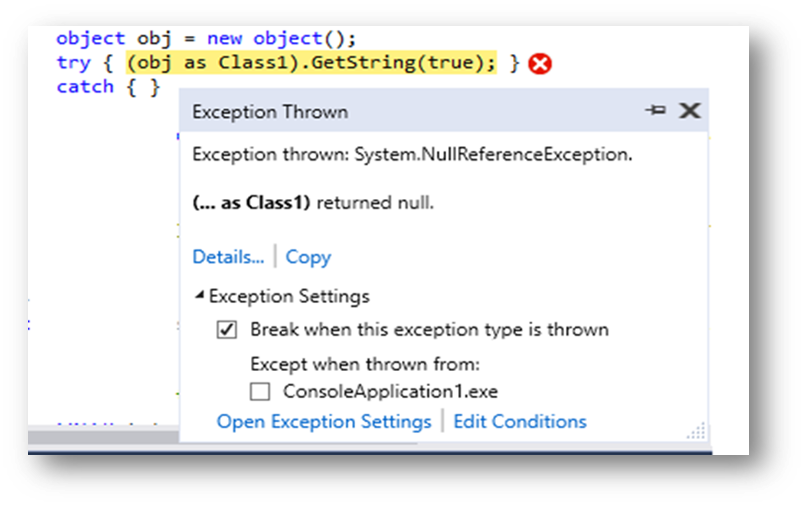
There's nothing more frustrating when you are trying to find the exact cause of errors in your code then having to step through layers and layers and layers of nested trees of information to find that one nugget of information that will give you the answer, that one "ah ha" moment of clarity. The new Exception Helper removes all of those layers and surfaces the most important information up to the top and presents it in a dialog box for easy access. Additional, you can set the Exceptions settings, you control what parts of your code will throw exceptions and what parts won't. This way if you have a troublesome section (or one that a particularly messy colleague that you want to skip, you can create an exception setting for it so that you can get on with the code you want to really work on. This is especially useful for those parts of your code that you always know you are going to hit exceptions, such as signon or authorization code.
Diagnostic Tools Window Updates
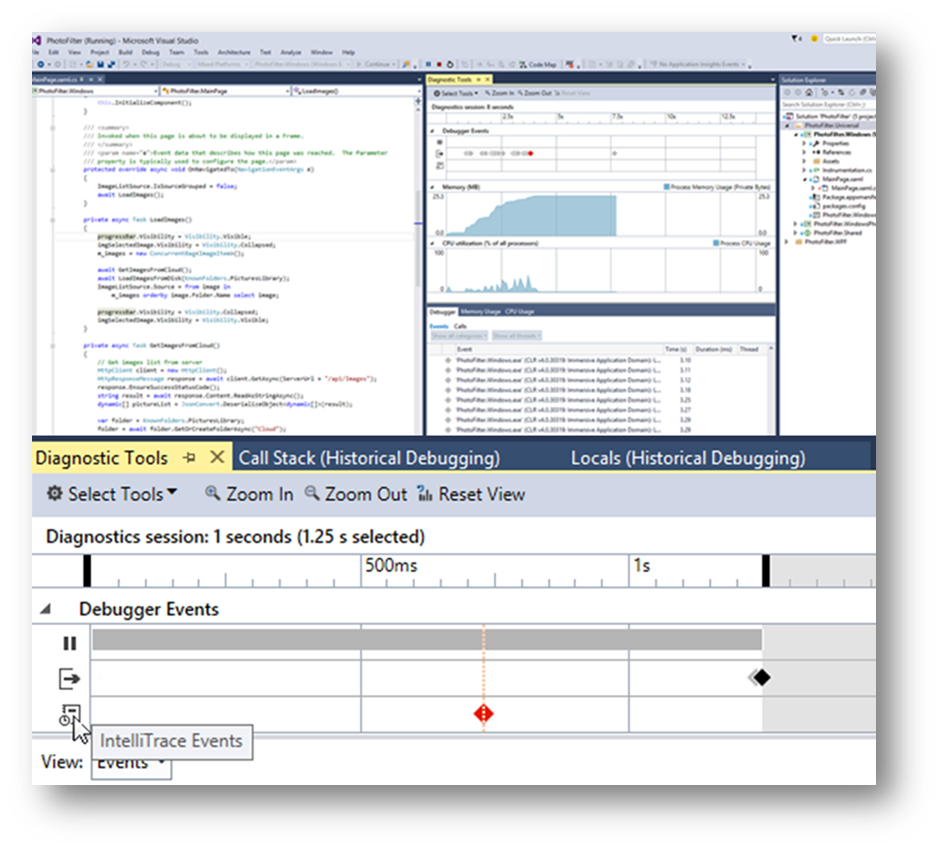 A new summary tab has been added to the Diagnostic Tools Window that let's you view the number of Application Insights and UI Analysis events (for UWP apps only) that occurred in your application. Also use the new window updates to take a memory snapshot of your heap as well as enable and disable CPU profiling
Performance Profiler Updates
The Performance Profiler can now attach (and re-attach) to a running process, saving valuable time starting and stopping and restarting your sessions to get the information that you need.
The CPU Usage Tool has several improvements including better external code support giving you better insights into the costs of library and framework functions when called by user code. Also the Functions view will now rank functions by their CPU cost.
Lastly, let's not leave off the new Click to Run feature. This works just like it sounds. Instead of setting endless breakpoints in your code (only to forget about them later), simply click on the green icon next to any line of code  to run the application up to that point. This makes it really easy to step into and out of conditional sections of your code.
I hope this has given you a good taste of the latest improvement to something that we tend to take for granted, a robust debugging toolset within Visual Studio 2017.